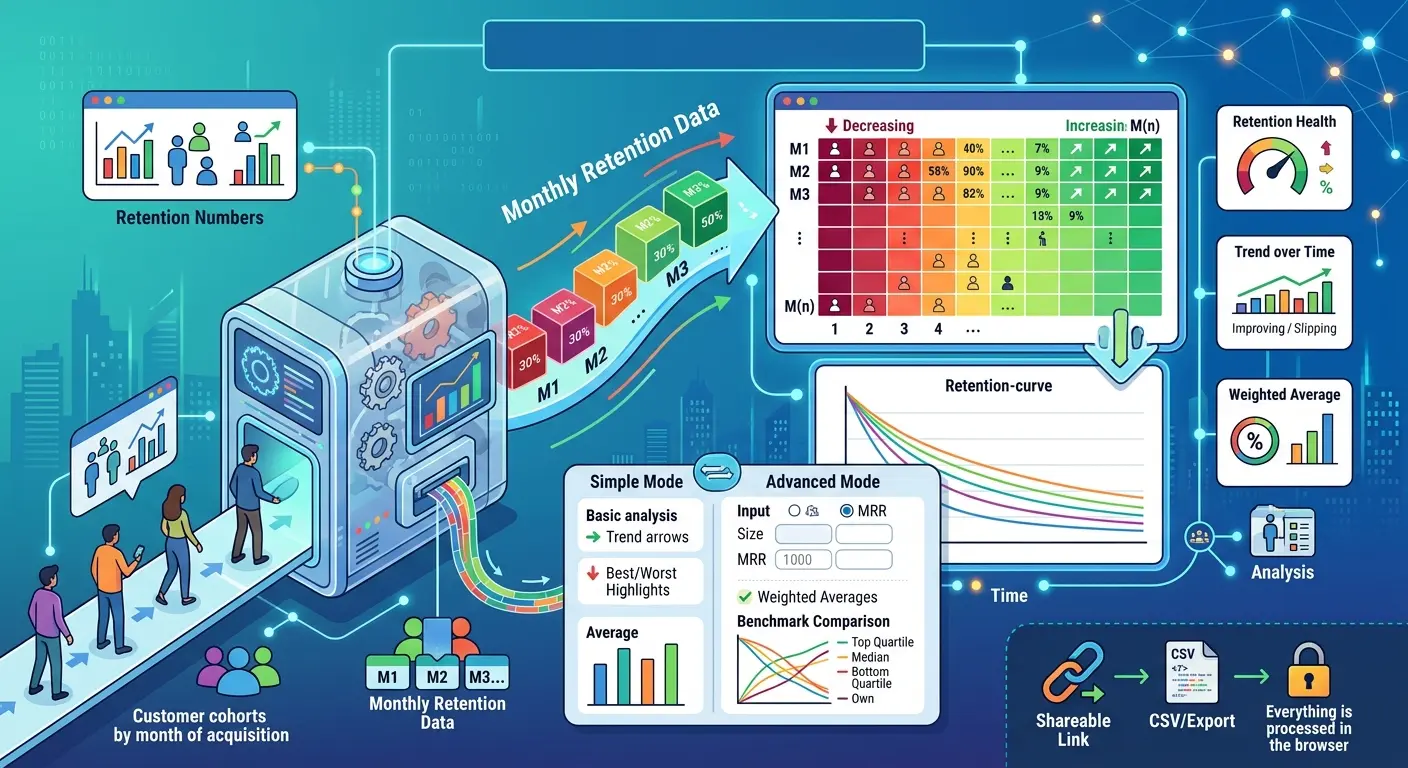
The Cohort Retention Calculator is a free, browser-based tool that turns your raw retention numbers into a clear visual story. You enter the percentage of each customer cohort that remains active in each month after acquisition, and the tool instantly produces a color-coded retention heatmap, a retention-curve chart, and a set of summary metrics that tell you whether your retention is healthy, improving, or quietly slipping.
A cohort is simply a group of customers grouped by when they signed up — for example, everyone who started in January 2024. Month 0 (M0) always represents 100% of that group, since everyone is present at the start. Each subsequent column (M1, M2, M3, and so on) shows what share of that original group is still around. Reading down a column tells you how a given month of tenure performs across cohorts; reading across a row tells you how a single cohort decays over time.
The tool works in two modes. Simple mode is built for quick analysis: type in your retention percentages and immediately see averages, your best and worst cohorts, and a plain-language insight about your trend. Advanced mode adds cohort size and MRR inputs, weighted retention, implied monthly and annual churn, and an optional overlay of industry benchmark curves so you can compare your performance against top-quartile, median, and bottom-quartile SaaS companies.
Nothing is stored on a server. Everything runs locally in your browser, and you can copy your data out as CSV or generate a shareable link that encodes your numbers directly in the URL.
Why Cohort Retention Matters
Most teams track a single blended retention or churn number, and that number lies. Blended metrics mix new and old customers together, so a flood of new signups can mask the fact that long-tenured customers are leaving. Cohort analysis fixes this by isolating each group and following it over time, which reveals the true shape of how customers stick around.
The shape matters enormously. A retention curve that drops fast and then flattens is the signal of a healthy product — you lose some customers early, but the ones who stay form a durable base. A curve that keeps declining month after month without flattening points to a leaky bucket, where growth has to constantly outrun churn just to stand still. Cohort retention is the cleanest way to see which of these two stories your business is telling.
Comparing cohorts over time also tells you whether the changes you ship actually work. If your March cohort retains better at M1 than your January cohort did, that improvement is evidence your onboarding, pricing, or product changes are landing. The tool surfaces exactly this comparison and translates it into a trend figure and a written insight, so you do not have to eyeball a spreadsheet to know whether you are getting better or worse.
Who Needs This Tool
SaaS founders and operators use cohort retention as one of the most important early signals of product-market fit. Before revenue is large enough to be meaningful, the shape of your retention curve tells you whether you have built something people keep using. This tool gives founders a fast way to check that without building a dashboard.
Product managers rely on cohort data to measure whether feature launches, onboarding redesigns, and activation experiments actually improve long-term stickiness. By naming cohorts around release dates, a PM can watch retention move and tie it to specific changes.
Growth and marketing teams need to know whether the customers they are acquiring actually stay. High acquisition paired with poor retention is an expensive treadmill. Cohort retention reveals when a particular channel or campaign brings in customers who churn quickly, which protects budget from being poured into bad-fit traffic.
Customer success and retention leaders use the heatmap to spot exactly when customers tend to drop off, so they can place interventions — check-ins, education, save offers — right before the danger month rather than after customers have already left.
Founders preparing to fundraise and the
investors and analysts evaluating them both care deeply about retention curves, because retention is one of the hardest metrics to fake and one of the strongest predictors of durable growth. A clean retention chart with benchmark context is a powerful slide in a pitch deck and a quick diligence check for an investor.
Consultants, agencies, and fractional operators working across multiple clients benefit from a tool that needs no setup. They can paste in a client's numbers, produce a clear visual in minutes, and share a link without standing up any infrastructure.
Key Features
The tool centers on an editable
retention grid where each row is a cohort and each column is a month of tenure. As you type, every cell is shaded with a
heatmap — strong retention glows green, middling numbers turn amber, and weak retention turns red — so problem areas jump out before you have read a single figure.
The
retention summary distills your data into the metrics teams actually report: average M1, M3, M6, and M12 retention, your best and worst cohorts by average retention, and a trend that compares your oldest cohort to your newest. A
health badge grades your overall retention from Excellent to Critical based on average M3 retention, and a plain-English
insight line explains what changed and what it might mean.
The
retention curve chart plots every cohort as its own line, with a dashed average line overlaid so you can see the typical decay path at a glance. Each cohort is color-coded and labeled in the legend.
Advanced mode unlocks weighted analysis. By entering the number of customers and the MRR for each cohort, you get a customer-weighted M1 figure (which prevents a tiny cohort from skewing your average), total and average cohort size, and implied
monthly and annual churn derived from your M12 retention. You can also switch on
industry benchmark overlays to compare your curve against top, median, and bottom performers.
Finally, the
export options let you copy your full table as CSV for use in a spreadsheet or deck, or generate a
share link that carries all of your data inside the URL — handy for sending a snapshot to a teammate or investor without any account.
How To Use It
Start by naming your cohorts. The default rows use month labels like Jan 2024, but you can rename them to match whatever grouping makes sense for you — acquisition month, campaign, plan tier, or signup quarter. Then fill in the retention percentage for each month you have data for. M0 is locked at 100% because, by definition, the entire cohort is present at the start. Leave later months blank if a cohort has not aged into them yet; the tool handles incomplete rows gracefully and simply excludes empty cells from its averages.
As you enter numbers, the heatmap, summary metrics, and curve update in real time. Use the
+ Add Cohort button to add rows up to a maximum of six, and the × button to remove any cohort you do not need.
When you want deeper analysis, switch to
Advanced mode using the toggle at the top. Enter each cohort's customer count and MRR, and optionally turn on the benchmark overlay to see where you sit relative to the wider SaaS market. When you are done, copy the data as CSV or grab a share link to save or send your analysis.
Understanding the Metrics
M1, M3, M6, and M12 retention are the percentages of a cohort still active one, three, six, and twelve months after they joined. M1 reflects how well your onboarding and early experience convert signups into habitual users. M3 is widely treated as the clearest read on whether customers have found durable value. M6 and M12 reveal long-term stickiness and are the figures investors scrutinize most.
Best and worst cohort rank your groups by their average retention across all filled months, giving you a quick pointer to which signup period performed best — often a clue about what was working at that time.
Retention trend compares the M1 retention of your oldest cohort to your newest. A positive trend means recent customers are sticking around better than earlier ones, which is exactly what you want to see after shipping improvements.
Implied churn is derived in Advanced mode from your M12 retention. Annual churn is the share of a cohort lost over a year, while implied monthly churn is the steady monthly rate that would compound to that annual figure. These are estimates based on your twelfth-month number, so they are most reliable once you have cohorts that have actually reached month twelve.
Weighted M1 averages your M1 retention by cohort size rather than treating every cohort equally, so a large cohort influences the number more than a small one. This gives a more accurate picture of how your typical customer behaves.
What Good Retention Looks Like
There is no single universal target, because retention norms vary widely by business model. Self-serve, low-price, consumer-style SaaS tends to see faster early drop-off, while enterprise software with annual contracts retains far more of each cohort. As a rough orientation, the benchmark curves built into the tool treat strong M1 retention in the mid-eighties, M3 in the mid-seventies, and M12 around sixty percent as top-quartile territory, with median performers landing meaningfully lower and bottom-quartile companies lower still.
More important than hitting any specific number is the
shape of your curve and its
direction over time. A curve that flattens into a stable plateau signals a loyal core, even if the starting drop is steep. And cohorts that retain progressively better as you ship improvements are the single most encouraging pattern a growing company can show. Treat the benchmarks as context, not as a verdict, and pay closest attention to whether your own trend is moving in the right direction.