what
SaaS break-even calculator tool does and who it's for (SaaS founders, startup CFOs, indie hackers).
What Is a SaaS Break-Even Point?
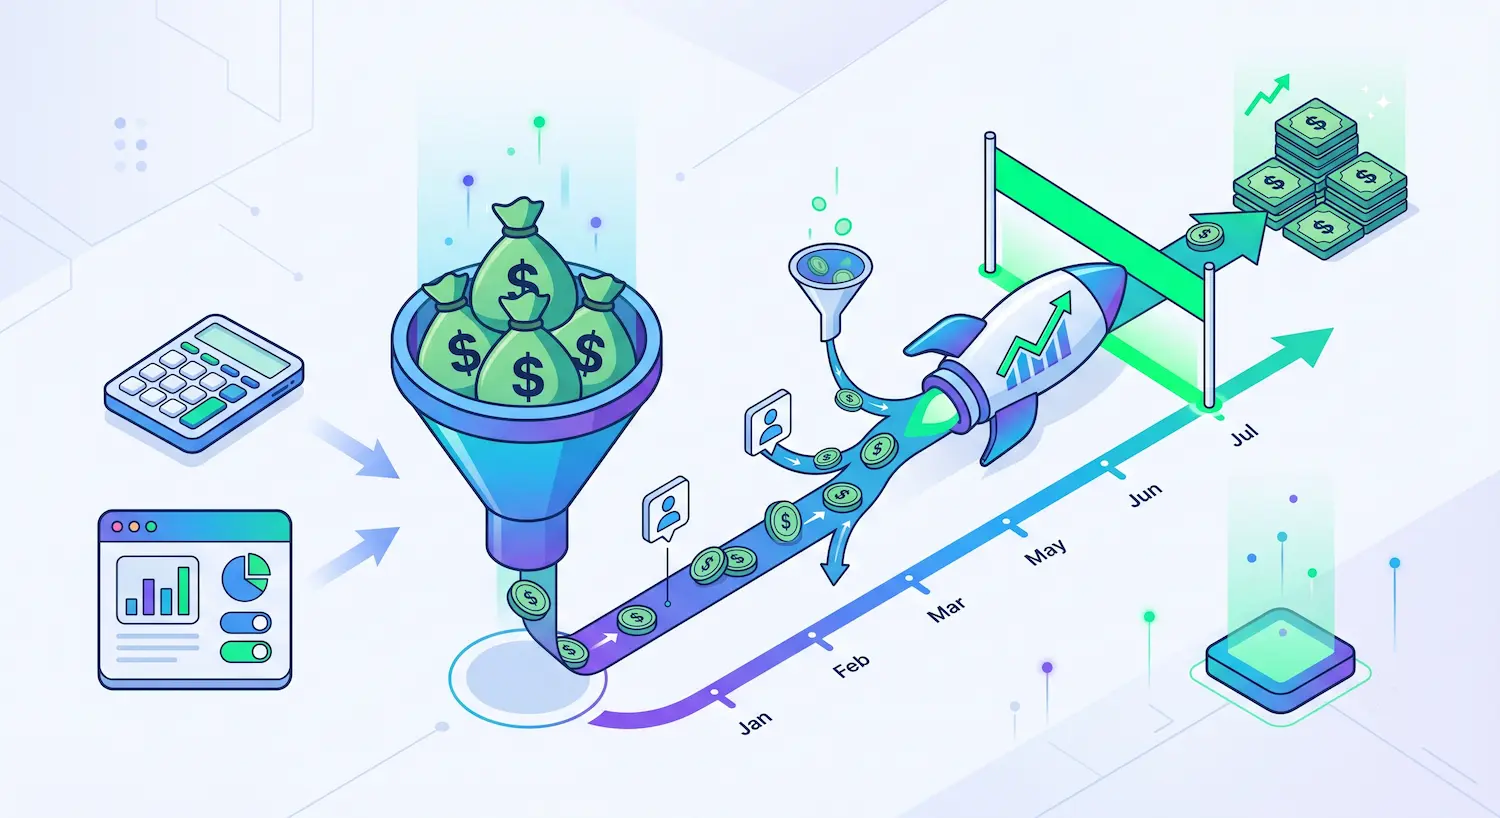
Explain that the break-even point is the number of paying customers (or the amount of monthly recurring revenue) at which total revenue exactly covers total costs — fixed plus variable. Clarify why this metric is foundational before any growth decisions are made. Distinguish between SaaS break-even and traditional product break-even (no COGS in the traditional sense; contribution margin dominates).
Why SaaS Unit Economics Are Different
Cover why SaaS businesses must think in per-customer economics rather than per-unit production costs. Explain the role of:
- Monthly Recurring Revenue (MRR)
- Churn and its effect on the break-even horizon
- High fixed cost / low variable cost structure typical of software businesses
- Why crossing the break-even threshold unlocks compounding profitability
How to Use the SaaS Break-Even Calculator
Step-by-step walkthrough of each input field:
Simple Mode:
- Monthly Fixed Costs — what counts (salaries, rent, tooling, infrastructure)
- Variable Cost per Customer — support costs, payment processing fees, per-seat infrastructure
- Price per Customer/Month — your MRR per seat or subscription tier
- Current Number of Customers — for real-time profit/loss snapshot
Advanced Mode:
- Fixed Cost Breakdown (salaries, infrastructure, marketing, other)
- Variable Cost Breakdown (payment processing %, support cost, infra cost per customer)
- Target Monthly Profit — reverse-engineer the customer count needed to hit a profit goal
- Pricing Tiers — blended contribution margin across Starter / Pro / Enterprise tiers
- Currency selection
Understanding Your Results
Explain each output metric in plain language:
Contribution Margin per Customer Price minus variable cost. The dollar amount each new customer contributes toward covering fixed costs and generating profit.
Contribution Margin Ratio Expressed as a percentage of revenue. Industry benchmarks: 80%+ = excellent (pure software), 60–80% = healthy, 40–60% = moderate, below 40% = needs attention.
Break-Even Customers The minimum subscriber count to cover all costs. Calculated as: Fixed Costs ÷ Contribution Margin per Customer (rounded up).
Break-Even Revenue Break-even customers × price per customer. The MRR threshold at which the business becomes self-sustaining.
Current Profit / Loss Real-time snapshot: (Current Customers × Contribution Margin) − Fixed Costs.
Safety Margin How far current customer count sits above or below break-even, expressed as a percentage. Negative = still pre-profit. Positive = buffer against churn.
Operating Leverage (Advanced) Ratio of fixed costs to total costs. High operating leverage means small revenue increases translate into large profit gains past break-even.
Scenario Comparison (Advanced) Side-by-side view of current pricing vs. +20% price increase vs. −20% variable cost reduction — useful for pricing strategy decisions.
SaaS Break-Even Formula — The Math Behind the Calculator
Present the core formulas clearly:
Contribution Margin = Price per Customer − Variable Cost per Customer
Break-Even Customers = CEIL(Fixed Costs ÷ Contribution Margin)
Break-Even Revenue = Break-Even Customers × Price per Customer
Safety Margin (%) = ((Current Customers − Break-Even Customers) ÷ Current Customers) × 100
Include a worked numerical example using realistic SaaS numbers (e.g., $10,000 fixed costs, $5 variable cost, $49/month price → 228 customers to break even).
What Is a Good Contribution Margin for SaaS?
Benchmark ranges with context:
| CM Ratio |
Assessment |
Typical Profile |
| 80%+ |
Excellent |
Pure-software, no human-in-the-loop delivery |
| 60–79% |
Healthy |
Software with moderate support overhead |
| 40–59% |
Moderate |
Software + professional services |
| 20–39% |
Thin |
High variable costs, review pricing |
| Below 20% |
Unsustainable |
Structural repricing needed |
How Pricing Tiers Affect Your Break-Even Point
Explain blended contribution margin across multiple tiers. Show how a customer mix weighted toward lower-tier plans raises the break-even threshold, while enterprise-heavy mixes dramatically reduce it. Tie this to the Pricing Tiers input in Advanced Mode.
Common Mistakes When Calculating SaaS Break-Even
- Forgetting payment processing fees (Stripe's 2.9% + $0.30 is a real variable cost)
- Treating server/infrastructure as purely fixed when per-customer cloud costs scale
- Ignoring churn — break-even assumes a static customer base
- Using gross revenue instead of net revenue (after refunds, discounts)
- Not accounting for annual vs. monthly billing differences
From Break-Even to Growth — What Comes Next?
Bridge from the calculator to broader SaaS financial planning:
- Setting a target profit goal and working backward to a customer target
- Using the safety margin to decide when to increase marketing spend
- How operating leverage accelerates profit growth past break-even
- LTV:CAC ratio as the next metric to track once break-even is understood
Who Should Use a SaaS Break-Even Calculator?
- Early-stage SaaS founders validating pricing before launch
- Startup CFOs and finance teams building investor-ready models
- Product managers evaluating whether a new pricing tier is viable
- Indie hackers and bootstrappers deciding when to leave their day job
- Investors and advisors stress-testing unit economics in due diligence